How to Draw Constellation Diagram | Everything You Need to Know
Constellation diagrams are pivotal in digital communication, visually depicting a signal’s amplitude and phase variations. These diagrams, created by plotting in-phase (I) and quadrature (Q) components, offer crucial insights into modulation schemes.
This article provides a concise guide to drawing constellation diagrams, offering step-by-step instructions and insights for engineers in digital communication.
Constellation Diagrams
A constellation diagram represents a signal that has been altered by a digital modulation technique, such as quadrature amplitude modulation or phase-shift keying. It displays the signal as a two-dimensional xy-plane scatter diagram in the complex plane at symbol sampling instants.
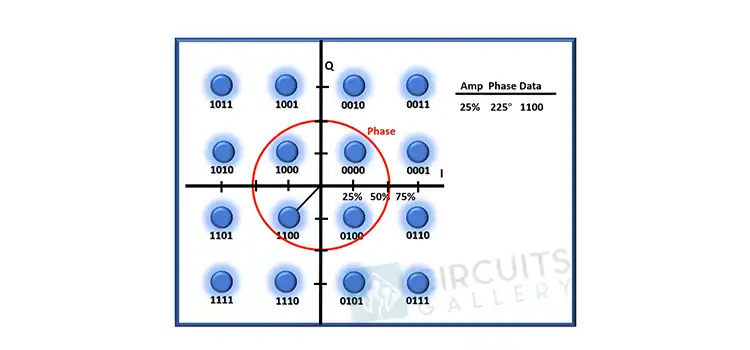
Similar to a phasor diagram, the angle of a point, measured counterclockwise from the horizontal axis, represents the carrier wave’s phase shift from a reference phase; the distance of a point from the origin represents the signal’s amplitude or power.
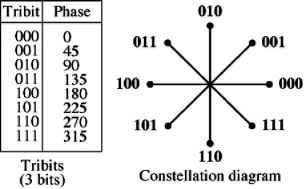
Image 1- Constellation Diagram
Types of Constellation Diagrams
Here are the types of constellation diagrams given below-
Quadrature Amplitude Modulation (QAM)
– QAM utilizes both amplitude and phase to represent multiple bits per symbol.
– Common variants include 16-QAM, 64-QAM, 256-QAM, etc., with varying density and complexity of points on the constellation.
– Higher-order QAM allows higher data rates but is more susceptible to noise and distortion.
Phase Shift Keying (PSK)
– PSK modulates data by altering the phase of the carrier signal.
– Variants such as Binary PSK (BPSK), Quadrature PSK (QPSK), and Offset QPSK (OQPSK) exhibit different phase shifts per symbol.
– PSK diagrams typically display points on a circular constellation, with equidistantly spaced symbols.
Frequency Shift Keying (FSK)
– FSK represents data by shifting the carrier frequency.
– In its simplest form, Binary FSK (BFSK), uses two frequencies to denote binary data (0s and 1s).
– Constellation diagrams for FSK are less commonly visualized due to their frequency-based nature.
Amplitude Shift Keying (ASK)
– ASK modulates data by varying the amplitude of the carrier signal.
– Constellation diagrams for ASK depict points along a single axis, showcasing different amplitude levels for symbols.
Orthogonal Frequency Division Multiplexing (OFDM)
– OFDM divides the data stream into multiple parallel sub-channels, each modulated using PSK or QAM.
– Each sub-channel constellation diagram combines to form the overall OFDM constellation, showing sub-carrier interactions and orthogonality.
Differential Modulation Schemes
– Differential techniques like Differential Phase Shift Keying (DPSK) or Differential Quadrature Amplitude Modulation (DQAM) use changes in phase or amplitude relative to the previous symbol rather than absolute values.
– Their constellation diagrams often emphasize phase or amplitude differentials between consecutive symbols.
Steps for Creating a Constellation Diagram
Creating a constellation diagram involves plotting the in-phase (I) and quadrature (Q) components of a digital communication signal on a Cartesian plane. Follow these steps to create a constellation diagram:
1. Signal Acquisition and Processing
Acquire Signal Data
– Obtain signal data from simulations, hardware, or software-defined radio tools.
– Ensure the data represents the transmitted symbols accurately.
Digital Signal Processing (DSP)
– Apply appropriate signal processing techniques to extract I and Q components.
– Demodulate the signal according to the modulation scheme used (QAM, PSK, etc.) to obtain separate I and Q values for each symbol.
2. Organizing the Data
Data Formatting
– Organize the extracted I and Q values into pairs corresponding to individual symbols or bits.
– Ensure the data pairs are correctly aligned and ready for plotting.
3. Visualization
Choose Plotting Tool
– Utilize software tools like MATLAB, Python with Matplotlib, or specialized communication software.
– Open the chosen plotting environment to begin the visualization process.
Create a Scatter Plot
– Plot the I component on the x-axis and the Q component on the y-axis.
– Each data pair represents a point on the scatter plot.
Plot Data Points
– Plot the organized I-Q data pairs as individual points on the scatter plot.
– Different symbols should be represented by different colors or markers for clarity.
4. Scaling and Labeling
Axis Scaling
– Scale the x and y axes appropriately to cover the range of I and Q values.
– Ensure the axes are evenly scaled to represent the signal’s amplitude and phase variations accurately.
Labeling and Legend
– Label the x and y axes as “In-phase (I)” and “Quadrature (Q),” respectively.
– Add a legend if plotting multiple symbol types or modulation schemes to clarify symbol representations.
5. Analysis and Interpretation
Symbol Interpretation
– Analyze the constellation diagram to understand the modulation scheme’s characteristics.
– Identify symbol clusters, density, and arrangement patterns, which signify specific information encoded in the signal.
Error Detection and Analysis
– Evaluate the diagram for signs of noise, distortion, or errors that may affect signal integrity.
– Identify points that deviate from their expected positions due to channel impairments.
6. Refinement and Optimization
Noise Reduction
– Implement additional filtering or noise reduction techniques if necessary to improve diagram clarity.
Adaptive Techniques
– Explore adaptive modulation strategies or signal processing methods to optimize the constellation diagram based on channel conditions.
Following these steps will enable you to create a clear and insightful constellation diagram, providing valuable insights into the transmitted digital communication signal. Adjustments and refinements can be made based on specific requirements and signal characteristics to enhance the diagram’s accuracy and readability.
Frequently Asked Questions
Are constellation diagrams used in practical communication systems?
Constellation diagrams are crucial in designing, analyzing, and debugging communication systems. They help engineers understand signal behavior, optimize system parameters, and troubleshoot transmission issues.
Do I need specialized expertise to interpret constellation diagrams accurately?
A basic understanding of modulation schemes and signal processing aids in interpreting constellation diagrams. Practice and familiarity with signal characteristics enhance accurate interpretation and analysis.
Conclusion
Creating a constellation diagram in digital communication systems provides valuable insights into signal performance, aiding in decoding and understanding the transmitted data. By following these steps and understanding the fundamental concepts, you can effectively visualize and interpret complex digital signals, enabling efficient communication system design and analysis.
Subscribe to our newsletter
& plug into
the world of circuits